Difference Between Binomial and Poisson Distribution
| BINOMIAL | POISSON | |
| Number of Trials and Outcomes | Fixed number of trials (n) with exactly two possible outcomes (often denoted as success and failure).Examples: Flipping a coin 5 times (n=5) with heads (success) and tails (failure) as outcomes. | Focuses on events occurring in a fixed interval (like time or space) with no limit on the number of possible events (can be zero, one, two, and so on).Examples: Number of customer arrivals in a store in an hour. |
| Probability | Deals with the probability of getting a specific number of successes (r) out of the total trials (n). It requires knowing the probability of success (p) beforehand, which remains constant throughout the trials. | Models the probability of observing a certain number of events (k) within the interval.It uses an average rate (λ) of event occurrence, not the probability of individual events. |
| Mean and Variance | Mean (μ) is n * p (number of trials times probability of success), and variance is n * p * (1 – p). | Both the mean (μ) and variance are equal to the average rate (λ) of event occurrence. |
Choosing the Right Distribution:
Use the binomial distribution when you have a fixed number of independent trials with two possible outcomes, and you want to know the probability of a specific number of successes.
Use the Poisson distribution when you’re dealing with events happening independently over a fixed interval, and you’re interested in the probability of a certain number of events occurring within that interval.
Here’s an analogy to illustrate the difference:
Imagine rolling a fair die multiple times (fixed number of trials). The binomial distribution can tell you the probability of getting exactly two sixes (successes) in five rolls (n=5).
Poisson distribution, on the other hand, is helpful if you’re concerned about the number of car accidents at a particular intersection every day (fixed interval).expand_more It can’t predict individual accidents, but it can model the likelihood of having, say, three accidents on a specific day based on the average daily accident rate.
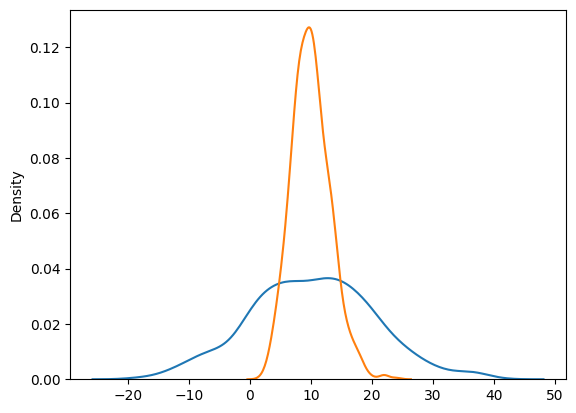
Example
from numpy import random
import matplotlib.pyplot as plt
import seaborn as sns

sns.distplot(random.normal(loc=10, scale=10, size=1000), hist=False, label='normal')
sns.distplot(random.poisson(lam=10, size=1000), hist=False, label='poisson')

plt.show()
Output

Leave a Reply